

How Does Data Visualization Help Explain Complex Information?
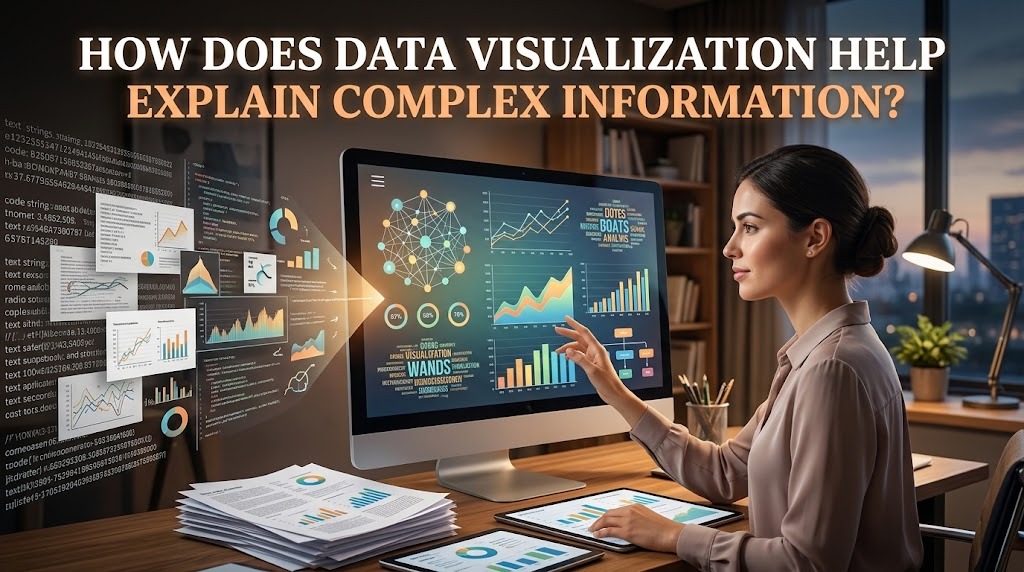
Data visualization helps explain complex information by transforming data into visual formats that are easier to understand, compare, and interpret. Large amounts of numbers, statistics, and written information can be difficult to process when presented only as text or tables. Visual elements such as charts, graphs, diagrams, and maps can make important details more noticeable and help readers understand the main message.
In education, business, research, and public communication, data visualization supports clearer explanations by presenting information in a structured and accessible way. However, effective visualization requires more than attractive designs. The data must be accurate, the visual format must suit the information, and the presentation must help the audience understand the intended message.
SIMPLIFYING LARGE AMOUNTS OF DATA
One of the main benefits of data visualization is its ability to simplify large amounts of information. When people need to review extensive datasets, reading every number or paragraph can take considerable time. A well-designed chart or graph can summarize the most important findings and provide an overview of the information. This allows the audience to understand the general situation before examining specific details.
For example, a report containing monthly sales figures for several products may be difficult to interpret as a long table. A visual representation can make differences between products and changes over time easier to recognize. By organizing information into a clear format, data visualization simplifies complex data without requiring the audience to examine every individual value immediately.
REVEALING RELATIONSHIPS AND PATTERNS
Complex information often contains relationships that are not immediately visible in raw data. Data visualization can help reveal patterns, trends, similarities, and differences by arranging information in a way that supports comparison. These visual relationships can help readers identify which factors change together, which categories perform differently, or where unusual results appear.
For instance, a researcher studying student attendance and academic performance may use a scatter plot to explore whether the two variables are associated. The visualization can reveal a possible relationship that deserves further investigation. However, visual patterns do not automatically prove causation. Additional analysis and contextual information are necessary before drawing conclusions about why a particular pattern occurs.
MAKING COMPARISONS EASIER TO UNDERSTAND
Comparing several datasets can become challenging when the information is presented in separate paragraphs or lengthy tables. Visual comparison makes it easier to examine differences between categories, groups, locations, or periods. By placing relevant information within the same visual structure, readers can identify similarities and differences more efficiently.
For example, a business may compare revenue across several branches using a bar chart. The chart allows managers to identify which branches generate higher or lower revenue and determine where further analysis may be useful. Similarly, students can compare survey responses or research findings through appropriate charts. This makes complex information easier to compare and helps audiences focus on the differences that matter most.
IMPROVING COMMUNICATION AND DECISION-MAKING
Effective data visualization can improve communication by helping people understand findings without requiring advanced technical knowledge. Visual presentations can support discussions among team members, researchers, managers, and other audiences who may have different levels of familiarity with the subject. Clear labels, relevant titles, and concise explanations help connect the visual information with the message being communicated.
In business, for example, a dashboard can present key performance indicators in one place so decision-makers can monitor progress and identify areas that need attention. In academic research, visual summaries can help readers understand important results more quickly. Nevertheless, data-driven decision-making should consider the quality of the data, relevant context, and other available evidence rather than relying on a chart alone.
CHOOSING VISUAL FORMATS THAT MATCH THE INFORMATION
The effectiveness of data visualization depends on selecting a format that fits the type of information being explained. A line chart is generally useful for showing changes over time, while a bar chart can compare values across categories. Scatter plots can help explore relationships between numerical variables, and maps can display information associated with geographic locations.
Design choices also influence how easily an audience understands a visualization. Clear labels, readable text, appropriate colors, and a logical layout can make information easier to interpret. Unnecessary decorative elements, misleading scales, or excessive details may distract readers or create inaccurate impressions. Therefore, effective data visualization should prioritize clarity, accuracy, and relevance rather than visual appearance alone.
CONCLUSION
Data visualization helps explain complex information by simplifying large datasets, revealing patterns, making comparisons easier, and supporting communication. Charts, graphs, maps, and dashboards allow audiences to recognize important findings without having to process every detail in its original form. These benefits make visualization useful in education, business, research, and many other fields.
However, visual presentations must be designed carefully to avoid confusion or misleading interpretations. Choosing the appropriate format, providing accurate labels, and explaining the context of the data are essential steps. When used responsibly, data visualization can make complicated information more accessible and help people develop a clearer understanding of the evidence presented.
Recent Posts

Bagaimana Sistem SKS pada Program Kuliah... 22.11.2026/46 View

How Does Technology Make Daily Evaluation... 21.11.2026/74 View

Apa Strategi Menghadapi Kesenjangan antara Kompetensi... 21.11.2026/75 View

Mengapa Inventaris Aset Penting bagi Kelancaran... 21.11.2026/72 View

When Should Musicians Join a Record... 21.11.2026/75 View
