

What Are the Differences Between Bar Charts Line Charts and Pie Charts?
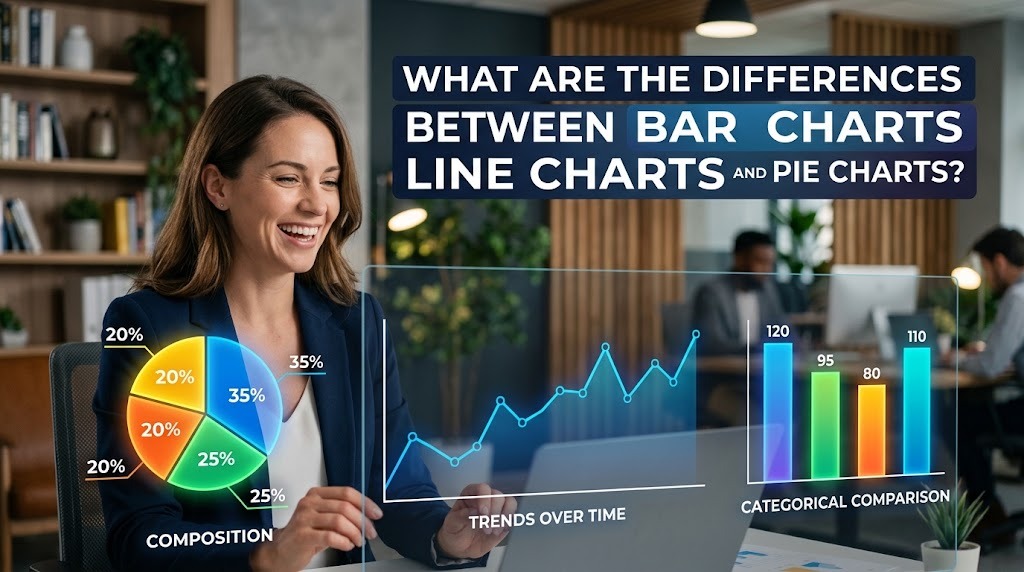
Bar charts, line charts, and pie charts are common types of data visualization used to present information clearly and systematically. Although all three help readers understand data, each chart has a different purpose. Bar charts are generally used to compare categories, line charts show changes over time, and pie charts illustrate how individual categories contribute to a whole.
Understanding the differences between bar charts, line charts, and pie charts helps students, researchers, and professionals select the most appropriate format for their information. A suitable chart makes data easier to interpret, while an unsuitable choice may confuse readers or hide important details.
UNDERSTANDING BAR CHARTS AND THEIR PURPOSE
A bar chart displays data using rectangular bars whose lengths or heights represent numerical values. It is commonly used to compare different categories, such as product sales, student scores, customer preferences, or business performance. Readers can quickly identify which category has the highest or lowest value by comparing the bars.
For example, a teacher may use a bar chart to compare average examination scores across several subjects. A business may also use one to compare sales figures for different products. Bar charts are particularly effective for comparing values across categories because the differences are easy to recognize. However, too many categories can make a chart difficult to read, so clear labels and a logical arrangement are important.
UNDERSTANDING LINE CHARTS AND THEIR PURPOSE
A line chart displays data points connected by lines, making it useful for showing changes over time or across an ordered sequence. It is frequently used to present trends, including monthly revenue, annual population growth, daily temperatures, and website traffic. The connected points help readers observe whether values are increasing, decreasing, or remaining relatively stable.
For instance, a company may use a line chart to examine its revenue over twelve months. The visualization can reveal periods of growth, declines, or recurring seasonal patterns. This makes line charts useful for tracking trends over time and understanding how values develop. However, the time intervals and axis scales should be represented accurately to avoid misleading interpretations.
UNDERSTANDING PIE CHARTS AND THEIR PURPOSE
A pie chart represents a whole as a circle divided into slices, with each slice showing the proportion contributed by a category. It is commonly used to display percentages or shares, such as household expenses, budget allocations, or survey responses. The size of each slice helps readers understand how much each category contributes to the total.
For example, a student may use a pie chart to illustrate how study time is distributed among several subjects. A business can also use one to show the percentage of total expenses allocated to different departments. Pie charts work best when presenting parts of a whole with a relatively small number of categories. When there are too many slices or the proportions are very similar, comparing them becomes more difficult.
COMPARING THE FUNCTIONS OF THE THREE CHARTS
The primary difference between these charts is the type of information each one communicates most effectively. A bar chart emphasizes differences between categories, a line chart highlights changes across an ordered sequence, and a pie chart shows the composition of a total. Understanding these purposes helps users choose a chart that matches their data and analytical objectives.
The choice also depends on the question being asked. If you want to determine which product sells the most, a bar chart is often appropriate. If you need to understand how sales change from month to month, a line chart may be more useful. If you want to show how different expenses contribute to an overall budget, a pie chart can communicate the proportions clearly. Selecting the correct data visualization format allows readers to focus on the most relevant information.
HOW TO CHOOSE THE RIGHT CHART FOR YOUR DATA?
Choosing the right chart begins with identifying the main message you want to communicate. Consider whether the goal is to compare categories, show a trend, or explain the proportions of a whole. The number of categories, the amount of available data, and the audience's familiarity with the subject should also influence the decision.
Good chart design is equally important. Use clear titles, readable labels, consistent units, and appropriate scales to make the information easier to interpret. Avoid unnecessary decorative elements or visual choices that exaggerate differences. By prioritizing accuracy and clarity, effective data visualization can help audiences understand the information without drawing conclusions that the data cannot support.
CONCLUSION
Bar charts, line charts, and pie charts serve different purposes in data visualization. Bar charts are suitable for comparing categories, line charts help illustrate trends and changes over time, and pie charts show how individual categories contribute to a whole. Each format becomes more useful when it is matched to the type of data and the message being presented.
Understanding these differences can help students, researchers, and professionals communicate information more effectively. Before creating a chart, consider what the audience needs to understand and choose the format that presents the evidence most clearly. With the right approach, data visualization can make information easier to interpret and support more informed decisions.
Recent Posts

Bagaimana Sistem SKS pada Program Kuliah... 22.11.2026/46 View

How Does Technology Make Daily Evaluation... 21.11.2026/74 View

Apa Strategi Menghadapi Kesenjangan antara Kompetensi... 21.11.2026/75 View

Mengapa Inventaris Aset Penting bagi Kelancaran... 21.11.2026/72 View

When Should Musicians Join a Record... 21.11.2026/75 View
