

What Are the Most Common Types of Data Visualization?
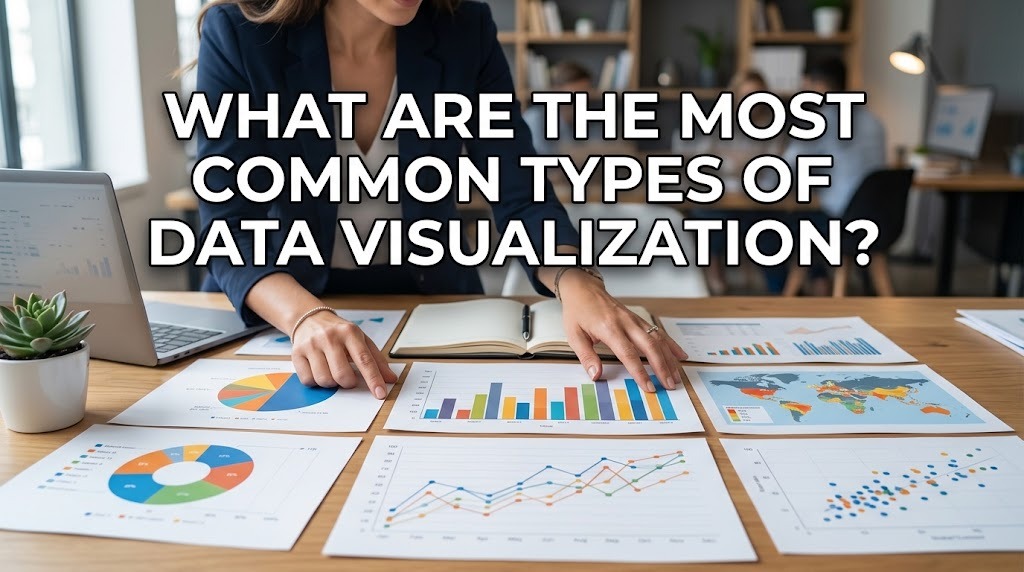
Data is used in many fields to understand performance, identify trends, and support decision-making. However, raw numbers and lengthy tables can make important information difficult to interpret. Data visualization solves this problem by presenting information through visual elements that help people recognize patterns, compare values, and understand relationships more easily.
There are many types of data visualization, and each is designed to communicate particular kinds of information. Bar charts, line charts, pie charts, scatter plots, heatmaps, maps, and dashboards are among the most common examples. Understanding how these visual formats work can help students, researchers, and professionals choose the most suitable method for presenting data clearly and accurately.
BAR CHARTS FOR COMPARING CATEGORIES
A bar chart uses rectangular bars to represent values across different categories. The length or height of each bar corresponds to the value being displayed, making it easy to compare groups at a glance. Bar charts are particularly useful when the goal is to identify which category has the highest or lowest value or to examine differences between several groups.
For example, a school can use a bar chart to compare the number of students participating in different extracurricular activities. A business can use the same format to compare product sales across departments or branches. Bar charts can be displayed vertically or horizontally, depending on the number and length of category labels. To maintain clarity, the chart should include a descriptive title, readable labels, and an appropriate scale. When designed correctly, bar chart visualization provides a straightforward way to communicate categorical comparisons.
LINE CHARTS FOR SHOWING TRENDS OVER TIME
A line chart displays data points connected by lines, making it useful for illustrating changes over time. The horizontal axis commonly represents time, while the vertical axis shows the measured value. This format helps viewers identify increases, decreases, fluctuations, and relatively stable periods within a dataset.
For instance, a company may use a line chart to monitor monthly revenue, while a researcher may use it to present changes in temperature across several weeks. Multiple lines can also compare trends between different categories, provided the chart remains easy to read. However, the time intervals and measurement scales should be presented accurately to avoid misleading interpretations. A line chart is generally most appropriate when the order of the data points matters. By using line chart visualization, readers can understand how a value changes and compare its development across a defined period.
PIE CHARTS FOR DISPLAYING PROPORTIONS
A pie chart represents the parts of a whole through slices of a circle. Each slice corresponds to a category's proportion of the total, allowing viewers to see how different components contribute to the whole. Pie charts are most effective when there are only a few categories and the differences between their proportions are reasonably easy to distinguish.
For example, a school might use a pie chart to show the percentage of students participating in several major activity groups. A business could use one to illustrate the distribution of a budget across a small number of departments. However, pie charts become harder to interpret when they contain many small slices or categories with similar values. In such situations, a bar chart may communicate the differences more clearly. A well-designed pie chart visualization should use clearly identified categories, accurate percentages, and a meaningful total so that the proportions are not misunderstood.
SCATTER PLOTS AND HEATMAPS FOR EXPLORING RELATIONSHIPS
A scatter plot uses individual points to display the relationship between two numerical variables. Each point represents an observation, with its position determined by the values of the variables being compared. This format can help reveal clusters, unusual observations, and possible associations that deserve further investigation.
For example, an education researcher may examine the relationship between study time and assessment scores. A scatter plot could reveal whether the two variables appear to move together, although the visualization alone cannot prove that one causes the other. A heatmap, by comparison, uses color intensity to represent the magnitude of values across a grid or matrix. Heatmaps can help users identify areas with relatively high or low values, such as activity levels across different days and hours. Both methods support exploratory analysis, but they require appropriate scales, labels, and context to ensure that viewers interpret the displayed relationships correctly.
MAPS AND DASHBOARDS FOR PRESENTING COMPLEX INFORMATION
Data visualization maps are useful when geographic location is an important part of the information. They can display differences between regions, the distribution of services, population patterns, or the locations of business activities. Depending on the dataset, maps may use colors, symbols, or proportional markers to represent values associated with specific places.
A data visualization dashboard combines several visual elements into one organized interface. It may contain charts, tables, summary indicators, and filters that allow users to examine different aspects of a dataset. Businesses often use dashboards to monitor sales, operational performance, and marketing results, while educational institutions may use them to review attendance or learning progress. A good dashboard should prioritize the most relevant information and avoid overcrowding the screen. Maps and dashboards serve different purposes, but both can help audiences understand complex information when their design matches the data and the intended task.
CONCLUSION
The most common types of data visualization include bar charts, line charts, pie charts, scatter plots, heatmaps, maps, and dashboards. Bar charts are useful for comparing categories, line charts illustrate changes over time, and pie charts show proportions of a whole. Scatter plots and heatmaps help explore relationships or value patterns, while maps and dashboards organize information by location or combine multiple indicators.
Choosing the right visualization depends on the type of data, the message being communicated, and the needs of the audience. A chart that works well for comparing categories may not be suitable for showing trends or geographic differences. By understanding the strengths and limitations of each format, users can create clear and accurate data visualizations that improve communication and support better analysis.
Recent Posts

Bagaimana Sistem SKS pada Program Kuliah... 22.11.2026/46 View

How Does Technology Make Daily Evaluation... 21.11.2026/74 View

Apa Strategi Menghadapi Kesenjangan antara Kompetensi... 21.11.2026/75 View

Mengapa Inventaris Aset Penting bagi Kelancaran... 21.11.2026/72 View

When Should Musicians Join a Record... 21.11.2026/75 View
