

What Data Science Tools Are Commonly Used by Professionals?
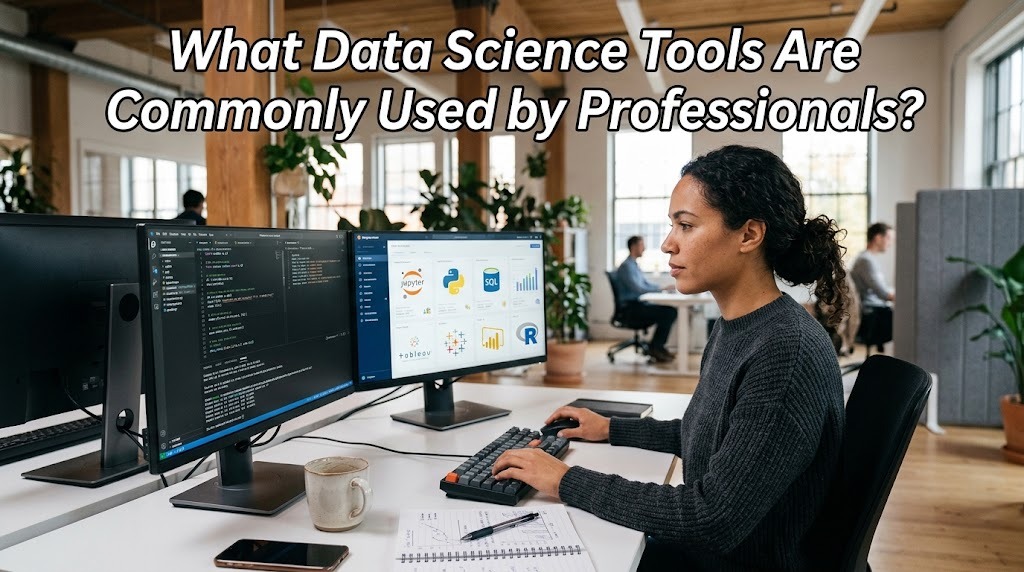
Data science has become an essential part of modern business, research, healthcare, education, and technology. Professionals use different tools to collect, clean, analyze, visualize, and interpret data to solve real-world problems. These tools help transform large amounts of raw information into valuable insights that support better decision-making. However, each tool has different functions, advantages, and limitations. Understanding the most commonly used data science tools can help beginners choose the right technologies and help professionals improve their analytical workflows.
PYTHON AND R FOR DATA ANALYSIS AND STATISTICS
Python is one of the most popular programming languages in data science because it is relatively easy to learn and supports a wide range of analytical tasks. Professionals use Python to clean datasets, automate repetitive processes, create visualizations, and develop machine learning models. Libraries such as Pandas help organize and manipulate data, while NumPy supports numerical calculations. Matplotlib and Seaborn are commonly used to create charts that make patterns easier to understand. Python is also supported by machine learning libraries such as Scikit-learn, making it useful for both beginners and experienced practitioners.
R is another programming language widely used for statistical analysis, research, and data visualization. It provides specialized packages for statistical modeling, hypothesis testing, and exploring complex datasets. Tools such as ggplot2 help users create detailed visualizations, while RStudio provides an environment for writing and running R code. Researchers and statisticians often choose R when their work requires extensive statistical methods or specialized analytical packages. The choice between Python and R depends on the project's requirements, the user's background, and the tools already used by the organization.
SQL AND DATABASE MANAGEMENT TOOLS
SQL, or Structured Query Language, is an essential tool for professionals who work with data stored in relational databases. It allows users to retrieve, filter, combine, summarize, and update information efficiently. For example, a data analyst can use SQL to identify the best-selling products in a particular month or compare customer purchases across different regions. SQL is particularly valuable when datasets are too large or complex to manage comfortably in spreadsheets. Learning SQL is therefore an important step for anyone interested in data analysis, data science, or business intelligence.
Professionals commonly work with database systems such as PostgreSQL, MySQL, and Microsoft SQL Server. These systems store information in structured tables and support queries that help users access the data they need. More advanced workflows may also involve cloud data warehouses such as Google BigQuery, Amazon Redshift, and Snowflake. These platforms support analytical workloads across large datasets and can integrate with visualization and data processing tools. Choosing the right database depends on factors such as data volume, performance requirements, security, cost, and existing infrastructure.
JUPYTER NOTEBOOKS AND DATA DEVELOPMENT ENVIRONMENTS
Jupyter Notebook is a popular environment for exploring data, writing code, testing analytical ideas, and documenting results in one interactive document. It supports code execution alongside text, equations, tables, and visualizations, allowing professionals to explain their analytical process clearly. Data scientists often use Jupyter Notebook to experiment with datasets, test hypotheses, and build early versions of machine learning models. Because the results appear alongside the code, notebooks are also useful for teaching, research, and collaboration. However, complex projects may require additional development practices to make code easier to maintain and deploy.
Other development environments, including Visual Studio Code and PyCharm, help professionals write, debug, organize, and maintain programming projects. These tools offer features such as code completion, debugging support, version control integration, and project navigation. Professionals may use notebooks for exploration and a development environment for building larger applications or reusable code. Git and GitHub are also useful for tracking changes, collaborating with teammates, and managing project versions. Together, these tools support a more organized and reproducible data science workflow.
POWER BI TABLEAU AND DATA VISUALIZATION TOOLS
Data visualization tools help professionals present complex information through charts, dashboards, and interactive reports. Microsoft Power BI is widely used to combine information from different sources, monitor key performance indicators, and share business reports. It is particularly useful for organizations that already rely on Microsoft products and services. Tableau is another popular platform known for interactive visual exploration and flexible dashboard creation. Both tools help users identify trends, compare performance, and communicate findings to people who may not have technical backgrounds.
Choosing between Power BI and Tableau depends on the organization's needs, budget, data sources, and reporting environment. Power BI may be attractive to businesses that use Microsoft services extensively, while Tableau can be useful for teams that prioritize interactive visual analysis. Professionals can also create visualizations directly through Python libraries such as Matplotlib, Seaborn, and Plotly. Regardless of the tool, effective visualization should make the main message clear without misleading the audience. Accurate charts, understandable labels, and appropriate scales are essential for communicating reliable conclusions.
MACHINE LEARNING AND BIG DATA TOOLS
Machine learning tools allow professionals to develop models that identify patterns, classify information, make predictions, and support automated decisions. Scikit-learn is commonly used for traditional machine learning tasks, including regression, classification, clustering, and model evaluation. For more complex deep learning applications, professionals may use TensorFlow or PyTorch. These frameworks support the development and training of neural networks for tasks such as image recognition, language processing, and other advanced analytical applications. The appropriate tool depends on the type of problem, the available data, and the computing resources required.
When organizations need to process extremely large datasets, they may use technologies such as Apache Spark and cloud-based data processing services. Apache Spark supports distributed data processing, allowing computations to run across multiple machines when the workload requires it. Cloud platforms such as Amazon Web Services, Microsoft Azure, and Google Cloud provide services for storing data, running analytical workloads, and deploying machine learning solutions. However, beginners do not need to learn every advanced framework immediately. Starting with Python, SQL, basic statistics, and data visualization is often more practical before progressing to machine learning and large-scale data processing.
CONCLUSION
Data science professionals use a variety of tools to manage different stages of the analytical process. Python and R support programming and statistical analysis, SQL helps retrieve information from databases, and Jupyter Notebook provides an interactive environment for exploration. Meanwhile, Power BI and Tableau help communicate findings, while machine learning frameworks and big data technologies support more advanced projects. No single tool is suitable for every task, so professionals should select technologies according to their objectives, data, and resources. For beginners, the best approach is to master a few foundational tools first and gradually expand their skills through practical projects.
Recent Posts

Bagaimana Sistem SKS pada Program Kuliah... 22.11.2026/46 View

How Does Technology Make Daily Evaluation... 21.11.2026/74 View

Apa Strategi Menghadapi Kesenjangan antara Kompetensi... 21.11.2026/75 View

Mengapa Inventaris Aset Penting bagi Kelancaran... 21.11.2026/72 View

When Should Musicians Join a Record... 21.11.2026/75 View
